What Is Volatility
Volatility is a statistical measure of how much an asset's price changes over a given period. The larger and faster the price fluctuations, the higher the volatility. The more stable the price, the lower the volatility.
In the cryptocurrency market, volatility is one of the defining characteristics of any asset. It creates opportunities for profit while also determining the level of investment risk. Understanding volatility is essential for building a trading strategy, managing positions, and evaluating portfolio risk.
How Volatility Is Measured
Historical Volatility (HV)
Historical volatility (HV) is calculated using actual price data from a past period. Mathematically, it is the standard deviation of an asset's returns, expressed as a percentage and annualized.
A simplified interpretation: if Bitcoin has an annualized volatility of 60%, this means that, statistically, its price is expected to remain within approximately ±60% of its current value over one year with a probability of about 68%.
Common historical volatility periods:
| Period | Typical Use |
|---|---|
| 7 days | Short-term trading, scalping |
| 30 days | Medium-term analysis, options strategies |
| 90 days | Market cycle evaluation |
| 1 year | Asset comparison, portfolio analysis |
Implied Volatility (IV)
Implied volatility (IV) is derived from options market prices. Rather than measuring past price movements, it reflects the market's expectations of future volatility. High implied volatility indicates that market participants expect significant price swings.
ℹ️ ATR — A Practical Tool
Traders often use ATR (Average True Range) to measure current market volatility. ATR shows the average price movement of an asset over a specified period (typically 14 candles) in absolute terms and helps traders place stop-loss orders at a reasonable distance from the current price.
Cryptocurrency Volatility vs Traditional Markets
Historically, the cryptocurrency market has been significantly more volatile than traditional financial markets.
| Asset | Typical Annual Volatility |
|---|---|
| Gold | ~15% |
| S&P 500 | ~15–20% |
| EUR/USD | ~5–8% |
| Ethereum (ETH) | ~70–90% |
| Bitcoin (BTC) | ~50–70% |
| Altcoins (Top 50) | ~80–120% |
| Meme Tokens | 200%+ |
These figures are approximate and vary significantly depending on the market cycle.
⚠️ Warning
During periods of market stress—such as large liquidation events, regulatory announcements, or major security breaches—cryptocurrency volatility can greatly exceed historical averages. Intraday price movements of 20–30% are not uncommon for individual altcoins.
Why the Cryptocurrency Market Is So Volatile
The high volatility of cryptocurrencies is driven by a combination of structural, informational, and technical factors.
Structural Factors
- Young market — the cryptocurrency market is less than 15 years old, and long-term price equilibrium has not yet fully developed.
- Lower liquidity — especially among smaller-cap assets; large orders can move the market significantly.
- No trading halts — unlike stock exchanges, crypto markets do not pause during sharp price movements and operate 24/7/365.
- Concentrated ownership — a significant portion of many tokens is held by a relatively small number of large holders ("whales").
Information-Driven Factors
- Regulatory news — decisions by regulators and governments can affect prices almost instantly.
- Narratives and hype — prices often move based on market expectations rather than underlying fundamentals.
- Social media — posts from influential figures or popular Telegram and X communities can rapidly change market sentiment.
Technical Factors
- Liquidation cascades — forced liquidations in futures markets can amplify price movements.
- Low barriers to entry — virtually anyone can launch a token and create speculative demand.
- 24/7 trading — because the market never closes, major events in any time zone can impact prices immediately.
Types of Volatility in Practice
Volatility Clustering
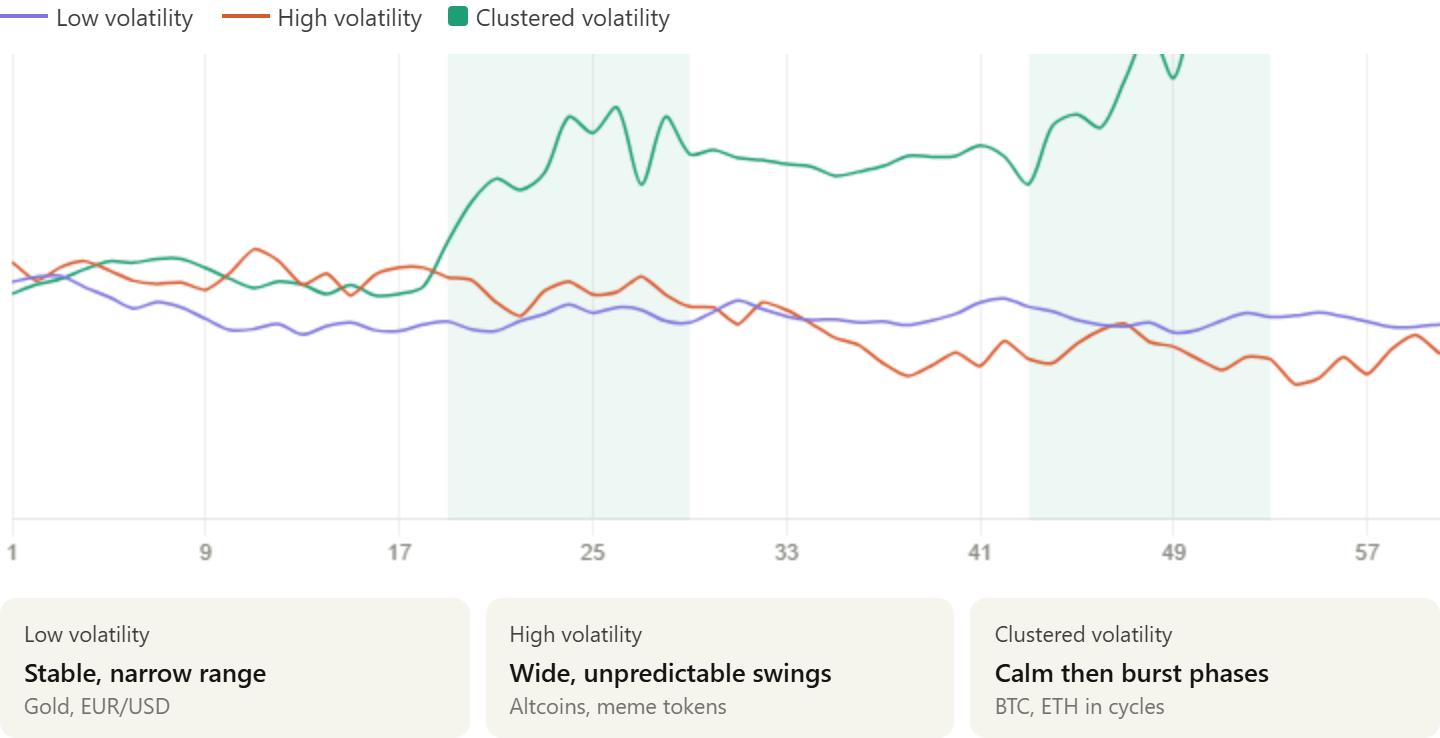
Volatility tends to cluster: periods of high volatility are often followed by more volatile conditions, while periods of calm tend to persist as well. After a significant price movement, the market typically remains volatile for some time. This behavior is widely used in statistical models such as GARCH (Generalized Autoregressive Conditional Heteroskedasticity).
Volatility Asymmetry
In most financial markets, volatility is higher during market declines than during rallies. Fear and panic spread faster than optimism and greed. As a result, sharp price drops usually occur much faster than market recoveries.
Volatility in Trading: Opportunity and Risk
How Traders Use Volatility
High volatility:
- Creates opportunities for short-term trades with high profit potential.
- Requires wider stop-loss levels to avoid being stopped out by normal market fluctuations.
- Increases the risk of slippage during order execution.
- Makes technical analysis less reliable, as support and resistance levels are more likely to be broken and quickly reclaimed.
Low volatility:
- Reduces short-term profit opportunities.
- Allows traders to use tighter stop-loss levels.
- Often precedes major price movements ("volatility compression" before a breakout).
- Is generally favorable for gradually accumulating positions.
Volatility Indicators
| Indicator | What It Measures | Common Use |
|---|---|---|
| Bollinger Bands | Band width reflects volatility | Narrow bands → potential breakout |
| ATR (Average True Range) | Average price movement over a period | Stop-loss placement |
| Crypto Volatility Indices | Implied volatility | DVOL (Deribit Volatility Index) for BTC/ETH |
| Standard Deviation | Statistical deviation from the mean | Position risk assessment |
Risk Management in High-Volatility Markets
High volatility requires a disciplined approach to capital and risk management.
Position Sizing
For highly volatile assets, traders generally reduce position size as volatility increases. A simple rule of thumb: if an asset's ATR is twice its normal level, reduce your position size by half to maintain the same monetary risk.
Volatility-Based Stop-Loss
A stop-loss placed too close to the current price on a highly volatile asset is likely to be triggered by normal market noise. A reasonable stop-loss distance should account for the asset's current ATR.
Rule of thumb: Place the stop-loss at least 1.5–2× ATR away from the entry price.
Diversification
Allocating capital across assets with different volatility profiles helps reduce overall portfolio risk. Stablecoins and Bitcoin are generally less volatile than small-cap altcoins.
💡 Helpful Tip
During periods of extreme volatility—such as major news events or large liquidation cascades—order book liquidity often decreases significantly. Large market orders executed during these periods may experience substantial slippage. Consider using limit orders or temporarily reducing your position size.
Volatility and Market Cycles
Bitcoin and the broader cryptocurrency market exhibit distinct volatility patterns throughout different market cycles.
| Market Phase | Typical Volatility |
|---|---|
| Accumulation (Bear Market) | Low; price trades within a narrow range |
| Early Uptrend | Moderate; gradually increasing |
| Bull Market | High; strong rallies with sharp corrections |
| Euphoria / Market Top | Extremely high; chaotic price action |
| Capitulation | Extremely high; rapid decline |
| Recovery | Gradually decreases as the market stabilizes |
💡 Helpful Tip
Before opening a position, check the asset's current volatility using ATR or the width of the Bollinger Bands on the Cifra X trading chart. If volatility is significantly above its historical average, consider reducing your position size, widening your stop-loss, or waiting for market conditions to stabilize.