What Is a Candlestick Chart
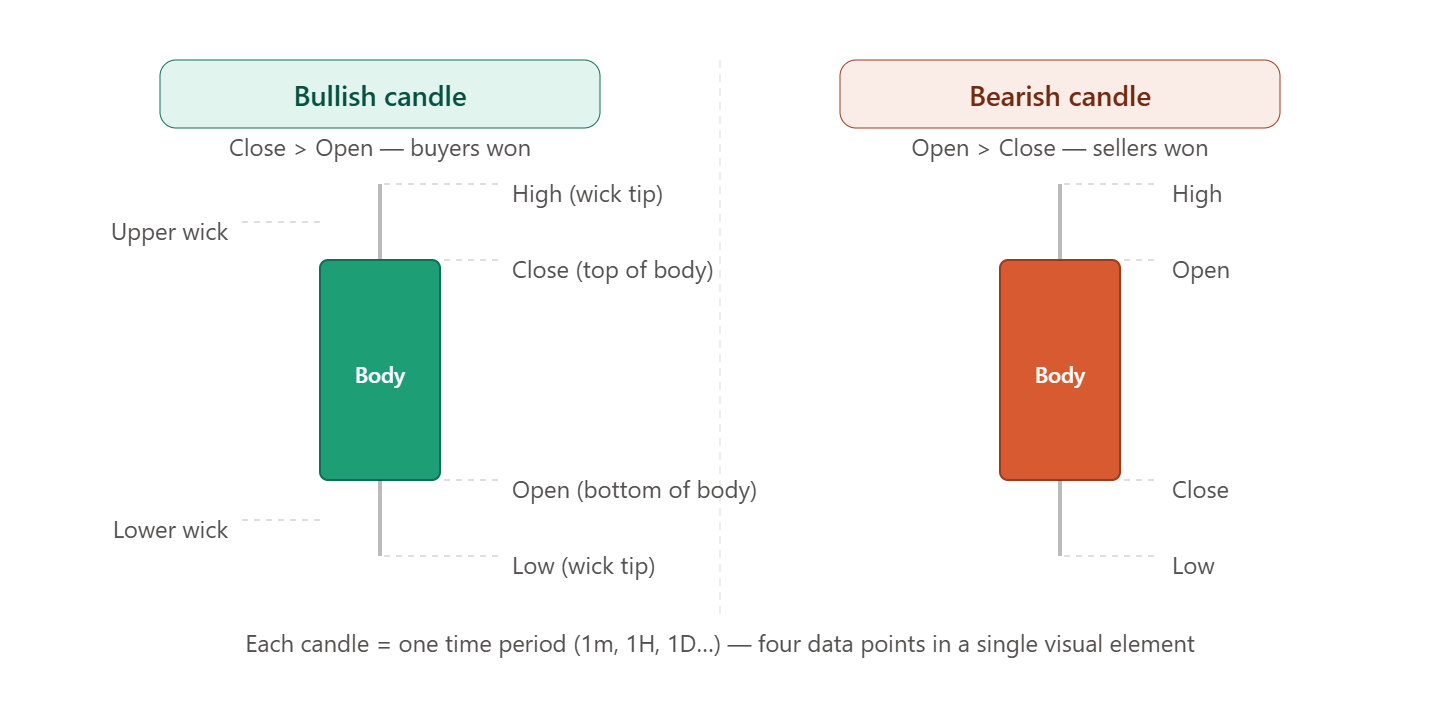
A candlestick chart is a method of visualizing an asset's price movement over a specific period of time. Each time interval is represented by a single graphical element—a candlestick. Every candlestick displays four key price values: the opening price, closing price, highest price, and lowest price for that period.
Candlestick charts provide significantly more information than simple line charts, which display only closing prices. Originating in Japan during the 18th century for analyzing rice prices, candlestick charts have become the standard visualization tool for technical analysis across all financial markets, including cryptocurrency exchanges.
Anatomy of a Candlestick
Each candlestick consists of two main components: the body and the wicks (also called shadows).
| Element | Description |
|---|---|
| Body | The range between the opening and closing prices. |
| Upper Wick | The highest price reached during the period (High). |
| Lower Wick | The lowest price reached during the period (Low). |
| Body Color | Indicates the direction of price movement during the period. |
Bullish and Bearish Candlesticks
- Bullish candlestick (green/white) — The closing price is higher than the opening price, indicating that buyers dominated during the period.
- Bearish candlestick (red/black) — The closing price is lower than the opening price, indicating that sellers dominated during the period.
Timeframes
Each candlestick represents a single time interval, known as a timeframe, selected by the trader. The same asset can appear very different depending on the chosen timeframe.
| Timeframe | Notation | Typical Use |
|---|---|---|
| 1 minute | 1m | Scalping, high-frequency trading |
| 5 minutes | 5m | Intraday trading |
| 15 minutes | 15m | Intraday trading |
| 1 hour | 1H | Short-term swing trading |
| 4 hours | 4H | Medium-term market analysis |
| 1 day | 1D | Position trading, primary analysis timeframe |
| 1 week | 1W | Long-term trend analysis |
💡 Helpful Tip
Beginner traders are encouraged to analyze multiple timeframes simultaneously. A higher timeframe (such as 1D) helps identify the overall market trend, while a lower timeframe (such as 1H) can be used to determine more precise entry points. This approach is known as multi-timeframe analysis.
Common Candlestick Patterns
Candlestick patterns are recurring formations consisting of one or more candlesticks that traders use to anticipate potential future price movements.
Single Candlestick Patterns
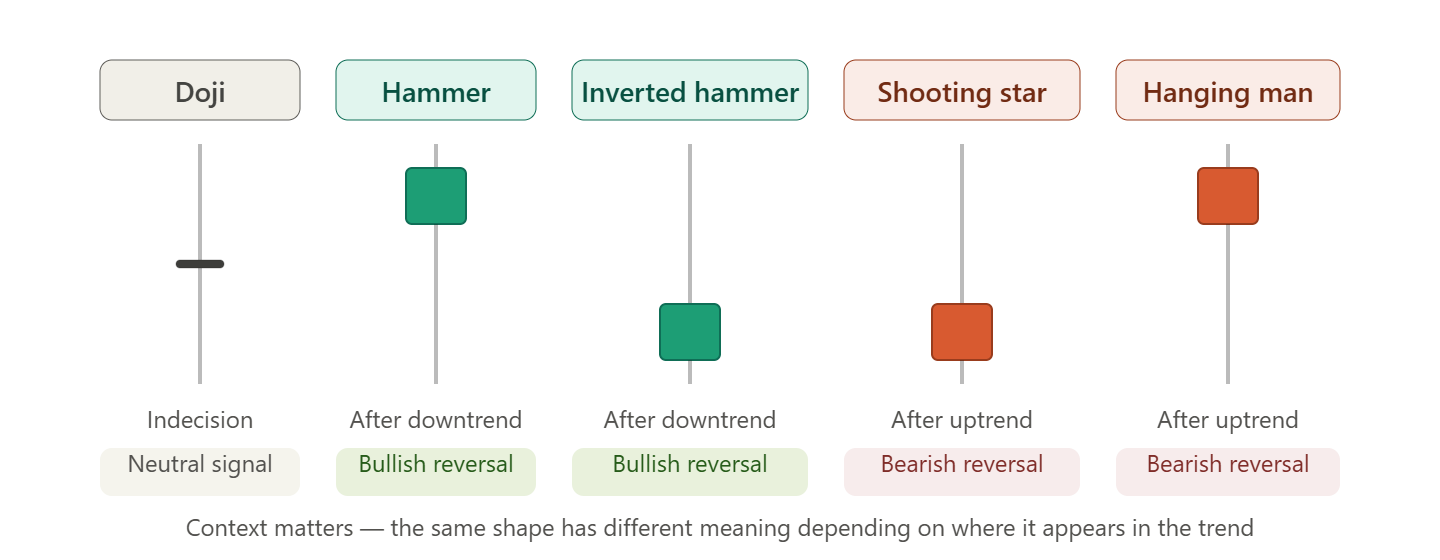
Doji — The opening and closing prices are nearly identical, resulting in a very small body. A Doji signals market indecision and a balance between buyers and sellers.
Hammer — A small body near the top of the candlestick with a long lower wick and little or no upper wick. It typically appears after a downtrend and may signal a potential bullish reversal.
Inverted Hammer — A small body near the bottom of the candlestick with a long upper wick. It appears after a decline and may indicate a potential bullish reversal.
Shooting Star — A small body near the bottom with a long upper wick. It typically forms after an uptrend and may signal a potential bearish reversal.
Hanging Man — Visually identical to the Hammer, but appears after an uptrend. It may indicate a potential bearish reversal.
Two- and Three-Candlestick Patterns
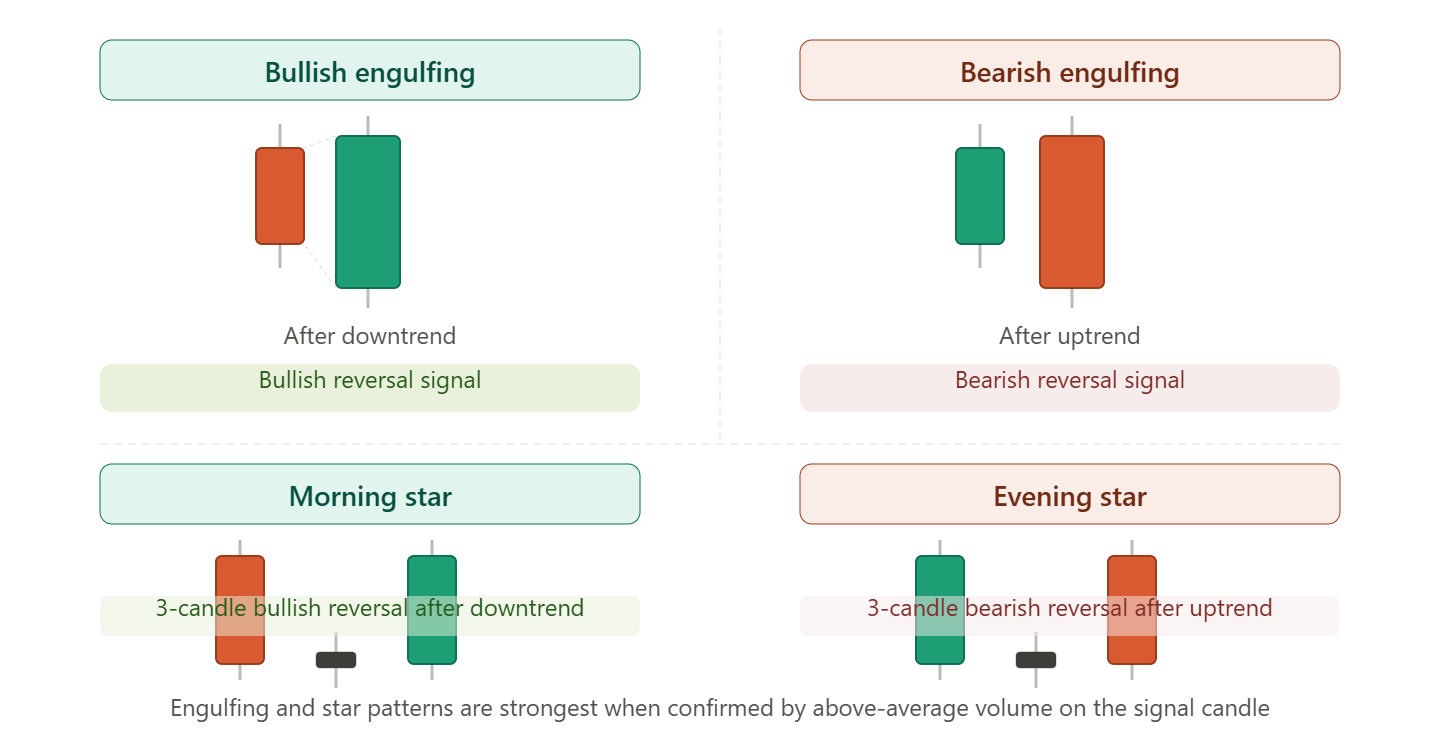
Bullish Engulfing — A bearish candlestick followed by a bullish candlestick whose body completely engulfs the previous candle's body. This is considered a strong bullish reversal signal.
Bearish Engulfing — The opposite pattern: a bullish candlestick followed by a bearish candlestick whose body completely engulfs the previous candle's body. It is considered a strong bearish reversal signal.
Morning Star — A three-candlestick pattern consisting of a large bearish candlestick, a small indecision candlestick (such as a Doji or another small-bodied candle), and a large bullish candlestick. It signals a potential reversal from a downtrend to an uptrend.
Evening Star — The mirror image of the Morning Star: a large bullish candlestick, followed by a small indecision candlestick, and then a large bearish candlestick. It signals a potential reversal from an uptrend to a downtrend.
Candlestick Pattern Reference
| Pattern | Candles | Typical Context | Signal |
|---|---|---|---|
| Doji | 1 | Any market condition | Indecision |
| Hammer | 1 | After a downtrend | Bullish reversal |
| Inverted Hammer | 1 | After a downtrend | Bullish reversal |
| Shooting Star | 1 | After an uptrend | Bearish reversal |
| Hanging Man | 1 | After an uptrend | Bearish reversal |
| Bullish Engulfing | 2 | After a downtrend | Bullish reversal |
| Bearish Engulfing | 2 | After an uptrend | Bearish reversal |
| Morning Star | 3 | After a downtrend | Bullish reversal |
| Evening Star | 3 | After an uptrend | Bearish reversal |
⚠️ Pattern Limitations
Candlestick patterns provide probabilistic signals, not guarantees of future price movement. They are significantly more reliable when combined with other analytical tools, such as support and resistance levels, trading volume, and trend indicators. Trading based solely on candlestick patterns without additional confirmation carries a high risk of false signals.
Candlestick Charts vs. Other Chart Types
| Chart Type | Displays | Primary Use |
|---|---|---|
| Line Chart | Closing prices only | General trend overview |
| OHLC Bar Chart | Open, High, Low, Close | Similar to candlesticks but less visual |
| Candlestick Chart | OHLC with visual emphasis | Standard for technical analysis |
| Heikin-Ashi | Smoothed candlesticks | Noise reduction and trend identification |
| Renko | Fixed-size price blocks, independent of time | Filtering sideways market noise |
Heikin-Ashi Candlesticks
Heikin-Ashi is an alternative candlestick calculation method that smooths price action by averaging data from previous candles. It is commonly used to identify trends more clearly, but because it modifies the actual opening and closing prices, it is not suitable for determining precise entry or exit levels.
Volume on a Candlestick Chart
Most candlestick charts include a volume histogram beneath the price chart, showing the total trading volume for each period. Analyzing price action together with volume provides a more reliable interpretation of market movements. For more information, see What Is Trading Volume.
ℹ️ Confirming Patterns with Volume
A candlestick pattern accompanied by high trading volume is generally considered much more reliable than the same pattern formed on low volume. For example, a Bullish Engulfing pattern with volume that is twice the recent average provides a much stronger signal than one formed with weak trading activity.
Support and Resistance on a Candlestick Chart
Candlestick charts make it easier to identify important price levels:
- Support — A price level where the market has repeatedly bounced upward.
- Resistance — A price level where the market has repeatedly reversed downward.
Clusters of long wicks around the same price level often indicate areas of strong buying or selling interest and may represent potential support or resistance zones.
How to Read a Candlestick Chart
Step-by-Step Analysis
- Choose the appropriate timeframe for your trading strategy.
- Identify the overall trend by examining higher highs and higher lows (or lower highs and lower lows).
- Mark key support and resistance levels based on previous price reversals.
- Look for recognizable candlestick patterns in recent price action.
- Check trading volume to determine whether it confirms the observed price movement.
- Use additional technical indicators (such as Moving Averages, RSI, or MACD) to validate the signal.
Candlestick Chart Features on Cifra X
The Cifra X trading chart includes:
| Feature | Description |
|---|---|
| Timeframe Selection | From 1 minute to 1 month |
| Volume Histogram | Displayed below the chart |
| Technical Indicators | MA, EMA, RSI, MACD, Bollinger Bands, and more |
| Drawing Tools | Trend lines, Fibonacci tools, rectangles, and other annotations |
| Saved Chart Layouts | Personal chart settings and annotations |
💡 Helpful Tip
Candlestick analysis is most effective when used alongside other analytical tools, not in isolation. Before entering a trade, compare the candlestick pattern with nearby support and resistance levels, trading volume, and at least one technical indicator to improve the quality of your trading decisions.