What Is Trading Volume
Trading volume is the total amount of an asset that has been bought and sold over a specified period of time. It can be measured either in units of the base asset (such as BTC) or in the quote currency (such as USDT).
Trading volume is one of the most fundamental indicators of market activity. It reflects the level of market participation by showing how actively traders are entering and exiting positions. Volume helps determine whether a price movement is supported by real buying and selling interest or is occurring with relatively little market participation. Without volume analysis, technical analysis of price charts remains incomplete.
How Trading Volume Is Calculated
Trading volume for a given period is the sum of all trades executed during that period. Each completed trade is counted once, regardless of whether it was initiated by the buyer or the seller.
Example (One Hour):
| Trade | Volume (BTC) | Price (USDT) | Notional Value (USD) |
|---|---|---|---|
| Trade 1 | 0.5 | $65,000 | $32,500 |
| Trade 2 | 1.2 | $65,100 | $78,120 |
| Trade 3 | 0.3 | $64,900 | $19,470 |
| Total | 2.0 BTC | — | $130,090 |
The 24-hour trading volume (24h volume) is the standard timeframe displayed on most cryptocurrency exchanges and market data platforms.
What Trading Volume Indicates
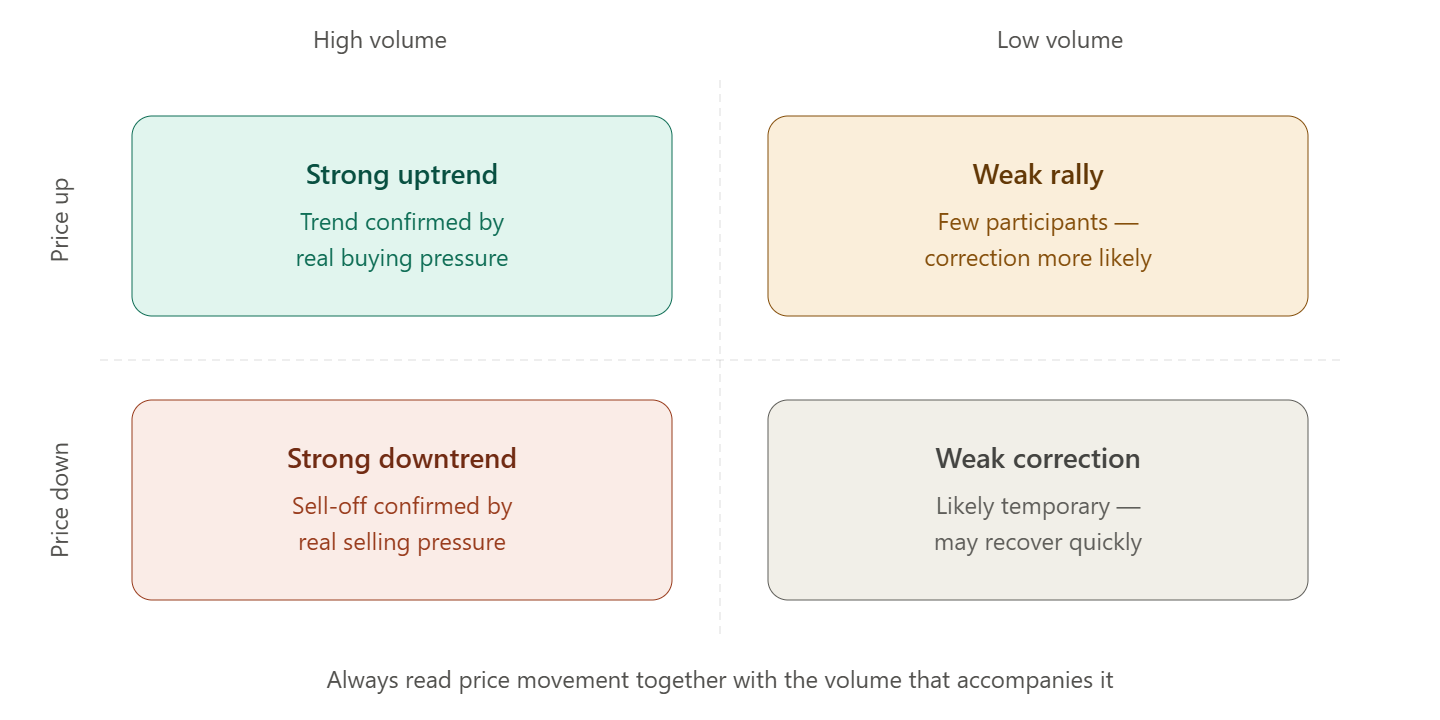
Trading volume is an indicator of the strength and reliability of a price movement. The same price movement can have very different implications depending on the amount of trading activity behind it.
Basic Interpretation
| Price Action | Volume | Interpretation |
|---|---|---|
| Rising | High | Strong uptrend supported by genuine buying demand |
| Rising | Low | Weak rally; a correction may follow |
| Falling | High | Strong selling pressure; bearish trend is confirmed |
| Falling | Low | Mild pullback; likely a temporary correction |
| Sideways | Low | Consolidation; market participants are waiting for direction |
| Sideways | High | Potential accumulation or distribution by large market participants |
Types of Trading Volume
24-Hour Volume (24h Volume)
The standard volume metric displayed by most cryptocurrency exchanges and market data platforms (such as CoinGecko and CoinMarketCap). It represents the total trading activity over the previous rolling 24 hours and is commonly used to:
- Compare the liquidity of different assets
- Measure genuine market interest
- Rank trading pairs by activity
Candlestick Volume
The trading volume displayed beneath each candlestick on a price chart. It allows traders to analyze market activity at specific price levels and during specific time intervals. For more information, see What Is a Candlestick Chart.
Volume Delta
Volume Delta is the difference between buy volume and sell volume over a given period. It indicates whether buyers or sellers were more aggressive during trading.
Delta = Buy Volume − Sell Volume
A positive delta indicates buying pressure and suggests upward momentum.
A negative delta indicates selling pressure and suggests downward momentum.
Cumulative Volume Delta (CVD)
Cumulative Volume Delta (CVD) is the running total of volume deltas over time. It helps traders determine whether buying or selling pressure is building throughout a trend.
Volume Profile
Volume Profile shows the distribution of trading volume across price levels rather than over time. It identifies the price levels where the greatest amount of trading activity has occurred.
Key Volume Profile Concepts:
| Term | Description |
|---|---|
| POC (Point of Control) | The price level with the highest trading volume. |
| Value Area | The price range where approximately 70% of total trading volume occurred. |
| HVN (High Volume Node) | A price level with heavy trading activity that often acts as support or resistance. |
| LVN (Low Volume Node) | A price level with relatively little trading activity, where price tends to move quickly. |
Trading Volume vs. Liquidity
Trading volume and liquidity are closely related, but they measure different aspects of the market.
| Metric | What It Measures |
|---|---|
| Trading Volume | The amount of an asset that has actually been bought and sold. |
| Liquidity | How easily an asset can be traded without causing significant price movement (slippage). |
High trading volume generally implies high liquidity, but not always. Trading volume can be artificially inflated through wash trading, a manipulative practice in which the same participant repeatedly buys and sells an asset to create the illusion of market activity.
⚠️ Wash Trading
Some exchanges have historically inflated their reported trading volume through wash trading. When evaluating an unfamiliar exchange or a lesser-known token, compare its reported volume with independent data providers (CoinGecko, for example, reports adjusted trading volume) and verify whether the activity is supported by actual trades in the trade history.
Using Trading Volume in Technical Analysis
Confirming a Breakout
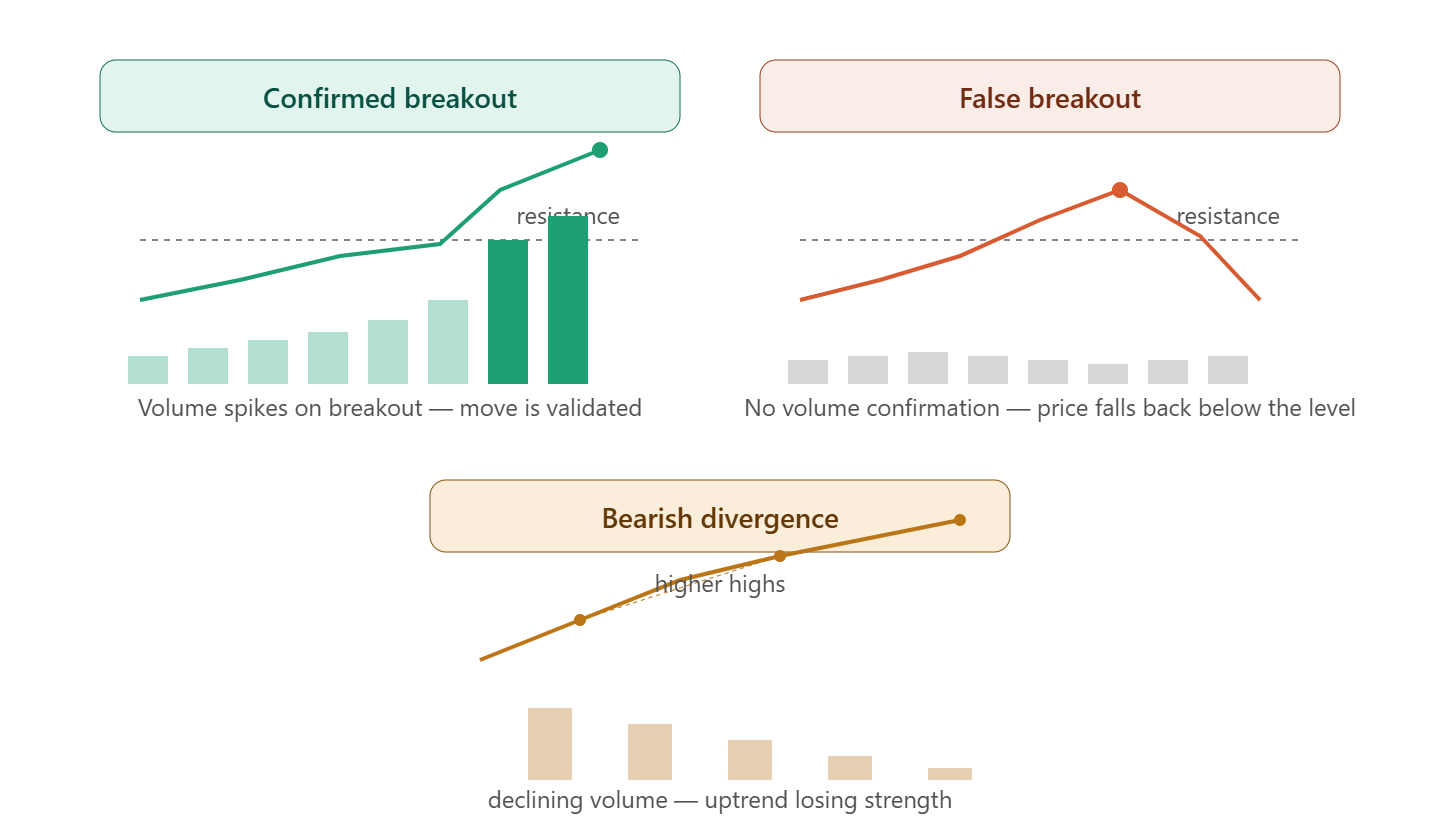
A breakout above resistance or below support is generally considered more reliable when it is accompanied by increasing trading volume. A breakout on low volume is more likely to be a false breakout.
Price breaks above resistance:

+ High volume → Breakout confirmed; continuation is more likely
+ Low volume  → Possible false breakout; price may return below resistance
Price–Volume Divergence
A divergence occurs when price and trading volume move in opposite directions. This often serves as an early warning signal of a potential trend reversal.
- Price reaches new highs while volume declines → The uptrend is weakening and lacks confirmation.
- Price reaches new lows while volume declines → Selling pressure may be fading, increasing the likelihood of a reversal.
Volume During Consolidation
A sharp decline in trading volume during a sideways consolidation phase often precedes a significant directional move, similar to the compression observed with Bollinger Bands. However, volume alone does not indicate the direction of the eventual breakout.
Total Market Trading Volume
In addition to the trading volume of individual assets and trading pairs, analysts monitor the total cryptocurrency market trading volume—the combined trading volume across all cryptocurrencies and exchanges.
Key observations:
- A sharp increase in total market volume during a market move suggests broad participation from traders.
- Declining volume while a trend continues may indicate that the move is losing momentum.
- Unusually high volume during a sideways market often signals active accumulation or distribution.
Trading Volume on Cifra X
The Cifra X trading interface displays trading volume in several places:
| Element | Location | What It Shows |
|---|---|---|
| Volume Histogram | Below the price chart | Trading volume for each candlestick |
| 24h Volume | Trading pair header | Total trading volume over the last 24 hours (in USDT) |
| Order Book Volume | Order book panel | Order sizes available at each price level |
| Trade Tape Volume | Trade tape | Size of each executed trade |
| Markets Page | Asset list | 24-hour trading volume for all trading pairs |
💡 Helpful Tip
Before opening a position, compare the current candle's trading volume with that of previous candles. If price is moving in your favor while volume is increasing, the move is generally supported by strong momentum. If price continues moving but volume declines, be prepared for a possible slowdown or trend reversal.